.png)
Happy National Bike Month,[1] everyone!
May is the month set aside to celebrate the joys of cycling! Consequently, it is a good time to explore the relationships between the nation’s most bicycle-friendly regions and their economic and demographic characteristics.
The League of American Bicyclists[2] publishes an annual ranking of states based on the following criteria:
- Number of bicycle-friendly actions taken
- Infrastructure and funding
- Education and encouragement
- Legislation and enforcement
- Policies and programs
- Evaluation and planning
In this article, we consider the Bicycle Friendly State 2017 Rankings in conjunction with other characteristics often found in the more highly ranked states.
Percentage of Total Population in Urban Areas
Based on the “infrastructure and funding” criterion used for the state rankings, one would think that urban areas might be more bike-friendly. With shorter distances to travel between destinations, urban areas would also intuitively seem to be more conducive to bicycle transit. When we compared the percentage of the total population found in urban counties[3] for each state to the Bicycle Friendly State rankings, we indeed found a strong relationship.[4]
While there is a great deal of variability, states that are ranked as more bike-friendly tend to have greater percentages of their populations concentrated in urban spaces. Six of the top ten states have over 80% of their populations located in urban counties, and seven of the bottom ten states have less than 60% of their populations located in urban counties.
Several other characteristics were related to bike-friendliness; but when we took all our variables together, these attributes were linked more directly to the urban variable. Two examples are:
- Percentage of workforce commuting via public transportation: the more workers commuting via public transit in each state, the greater the concentration tends to be in urban counties.[5] This relationship is intuitive as we would expect greater availability of public transportation services in areas with a population density high enough to support them.
- Percentage of population foreign-born: the greater the percentage of foreign-born residents living in each state, the greater the concentration tends to be in urban counties.[6] There could be many reasons for this relationship. For example, it’s possible that immigrants are drawn to more urban areas due to the expectations of greater work opportunities.
To sum up, bike-friendly states are more likely to have a greater concentration of its population located in urban areas and, indirectly, a greater percentage of public transit commuters and foreign-born residents.
Average Annual Wages Per Worker
One additional variable that showed a strong relationship[7] with the Bike-Friendly State rankings is the average annual wages per worker for each state. That is, states that were more bike-friendly tended to have higher average wages.
The state with the highest average annual wage is the fourth-most bike-friendly, Massachusetts at $68,770, and the state with the lowest average annual wage is fortieth-most bike friendly, Mississippi at $38,307. There could be a host of factors to explain this relationship. Some research[8] has shown that cyclists tend to have higher-than-usual income levels—with 24% of the cyclists in a recent survey reporting a housing income of $100,000 or more.
It could also be that the states that are bike-friendly also tend to have more robust economies in general. Perhaps high-earning workers are attracted to areas that are bike-friendly, or perhaps high-earning workers care more about making their communities bike-friendly.
Whatever the explanation, there seems to be a relatively strong relationship. Four of the top ten states have an average annual wage per worker over $60,000, and five of the bottom ten states have an average annual wage per worker under $45,000.
One important piece of information to keep in mind while making these comparisons is that there will likely be a great deal of variation within most states. MSAs, counties, and places within each state will differ in their emphasis on making their communities bike-friendly. Sufficient data don’t exist to make comparisons across the nation on more detailed regional levels. So, we would caution you to use these comparisons as prompts for further research rather than hard-and-fast relationships.
Having said that, some states and municipalities provide information on bike paths and cycling activity within their regions. For example, consider Washington—the #1 state in the 2017 rankings. When we add the layer of bike lanes[9] from the Washington State Department of Transportation to our JobsEQ™ Maps[10] analytic, we can see visually how different variables might correspond to the common cycling areas.
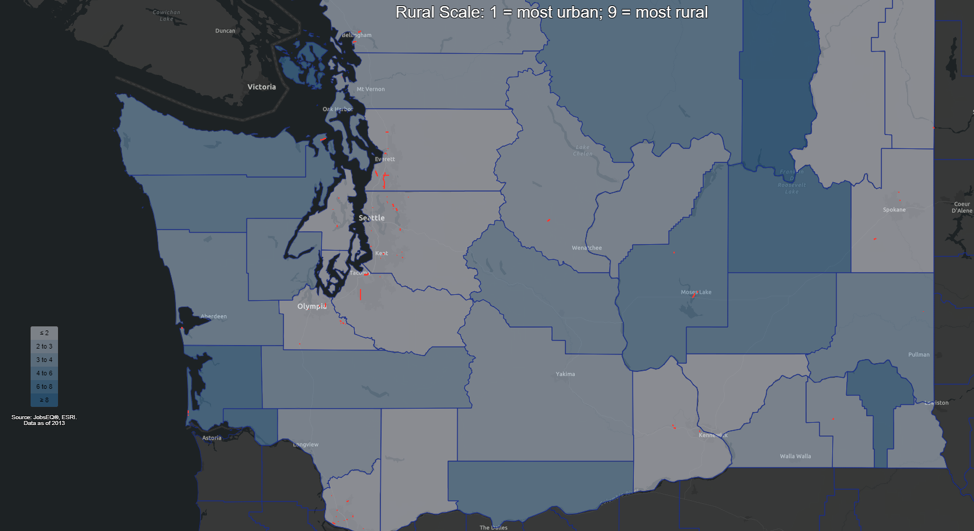

Consider again the relationship between the urban/rural classifications for each of Washington’s counties and the concentration of bike paths currently in operation throughout the state. In the image above, the bike lanes throughout the state are shown in red, with the rural counties shaded darker and the urban counties shaded lighter. Consistent with the trend involving state-level urban population and bike-friendly state rankings, the Washington counties classified as more urban generally tend to also be those with the highest concentration of bike lanes.
[1] See here for more information on National Bike Month: http://bikeleague.org/bikemonth
[2] See here for more information on the League of American Bicyclists, as well as the Bicycle Friendly State 2017 Rankings used in the article: http://bikeleague.org/content/ranking
[3] To estimate the percentage of population in urban counties, we used the ACS 2012-2016 population in counties with a Rural-Urban Continuum Code of “1” as a percentage of the total population for each state.
[4] Pearson correlation coefficient of -0.65 between the state numeric ranking and the percentage of total population found in urban counties.
[5] Person correlation coefficient of 0.52 between the percentage of the workforce commuting via public transportation and the percentage of total population found in urban counties.
[6] Pearson correlation coefficient of 0.68 between the percentage of population foreign-born and the percentage of total population found in urban counties.
[7] Pearson correlation coefficient of -0.62 between the state numeric ranking and the average annual wages (using wage data as of 2017Q4).
[8] Damant-Sirois, G., Grimsrud, M. & El-Geneidy, A.M. What’s your type: a multidimensional cyclist typology. Transportation (2014) 41: 1153. See Table 2: Demographic characteristics.
[9] See here for the WSDOT special use lanes date set, filtered for bike lanes: http://geo.wa.gov/datasets/WSDOT::wsdot-roadway-data-special-use-lanes/data?selectedAttribute=SUType&where=SUType%20%3D%20%27BL%27
[10] Our Maps analytic in JobsEQ™ allows users to upload custom shape files as layers to place on top of the many regional data sets available within the program.