.png)
A lot has already been said regarding Amazon and its search for a second headquarters (HQ2). Some argue HQ2 will bring a great benefit to the selected region, with Amazon saying they will invest over $5 billion and hire up to 50,000 employees for HQ2. Others have been more critical, arguing that the cost in the form of tax subsidies may not be worth the benefit gained. Additionally, there has been a lot of comparing the cities competing for HQ2, with front runners including Austin, Washington DC, and Denver, depending on which analysis you read.
Here, we don’t intend to “pick a winner” for which finalist city will be chosen for Amazon’s HQ2. Rather, the purpose of this analysis is to explore the existing labor market for the occupations that Amazon HQ2 will likely demand in the finalist cities, using job postings data to measure current labor supply and demand to compare the cities.
The first thing we need to do is determine the occupations that Amazon will likely be hiring for at its HQ2. To do this we use JobsEQ RTI job postings data to look at the job openings for which Amazon has advertised at its current Seattle headquarters. Looking at every posting from Amazon for its headquarters in the past year,[1] we see that there are four broad occupation groups that make up the large majority of Amazon postings: computer occupations (SOC 15-1000), advertising, marketing, promotions, public relations, and sales managers (11-2000), operations specialties managers (11-3000), and business operations specialists (13-1000). Over half of all postings are in the first occupation group, computer occupations, while these four occupation groups combined make up 84% of the total job postings that Amazon placed for its Seattle headquarters in the past year. Amazon HQ2 will likely be filling jobs in the same occupation groups, so these are the occupations we examine below in the finalist cities.
| Occupation | Percent of Postings |
|---|---|
| Computer Occupations | 52% |
| Advertising, Marketing, Promotions, Public Relations, and Sales Managers | 17% |
| Operations Specialties Managers | 7% |
| Business Operations Specialists | 7% |
| Source: JobsEQ RTI, Amazon |
While there are twenty finalist “cities” selected by Amazon, here we are looking at the larger metro regions associated with each finalist, and only those in the United States. Because Toronto is not in the United States and five other finalists are within two metro areas (Newark and New York City in the NYC Metro area; Washington DC, Montgomery County, MD, and Northern Virginia in the Washington DC Metro area), we are left with sixteen distinct metro areas for our analysis:
- Atlanta-Sandy Springs-Roswell, GA MSA
- Austin-Round Rock, TX MSA
- Boston-Cambridge-Newton, MA-NH MSA
- Chicago-Naperville-Elgin, IL-IN-WI MSA
- Columbus, OH MSA
- Dallas-Fort Worth-Arlington, TX MSA
- Denver-Aurora-Lakewood, CO MSA
- Indianapolis-Carmel-Anderson, IN MSA
- Los Angeles-Long Beach-Anaheim, CA MSA
- Miami-Fort Lauderdale-West Palm Beach, FL MSA
- Nashville-Davidson--Murfreesboro--Franklin, TN MSA
- New York-Newark-Jersey City, NY-NJ-PA MSA
- Philadelphia-Camden-Wilmington, PA-NJ-DE-MD MSA
- Pittsburgh, PA MSA
- Raleigh, NC MSA
- Washington-Arlington-Alexandria, DC-VA-MD-WV MSA

| Computer Occupations | Advertising, Marketing, Promotions, Public Relations, and Sales Managers | Operations Specialties Managers | Business Operations Specialists | |
|---|---|---|---|---|
| Atlanta | 107,025 | 18,712 | 39,419 | 108,312 |
| Austin | 54,984 | 5,320 | 11,572 | 38,550 |
| Boston | 132,913 | 26,317 | 61,330 | 111,745 |
| Chicago | 139,228 | 36,631 | 71,999 | 170,300 |
| Columbus | 39,933 | 4,905 | 15,021 | 42,662 |
| Dallas | 131,241 | 15,205 | 39,829 | 119,637 |
| Denver | 65,671 | 7,364 | 14,935 | 73,476 |
| Indianapolis | 30,297 | 5,060 | 12,089 | 37,220 |
| Los Angeles | 168,910 | 42,782 | 81,967 | 235,840 |
| Miami | 59,486 | 10,475 | 22,824 | 93,288 |
| Nashville | 24,252 | 5,641 | 16,173 | 32,410 |
| New York | 287,100 | 60,423 | 130,852 | 330,229 |
| Philadelphia | 87,154 | 12,919 | 33,955 | 102,474 |
| Pittsburgh | 33,025 | 4,047 | 11,734 | 34,695 |
| Raleigh | 32,867 | 3,086 | 8,157 | 26,211 |
| Washington DC | 206,973 | 17,828 | 52,854 | 226,152 |
| Source: JobsEQ |
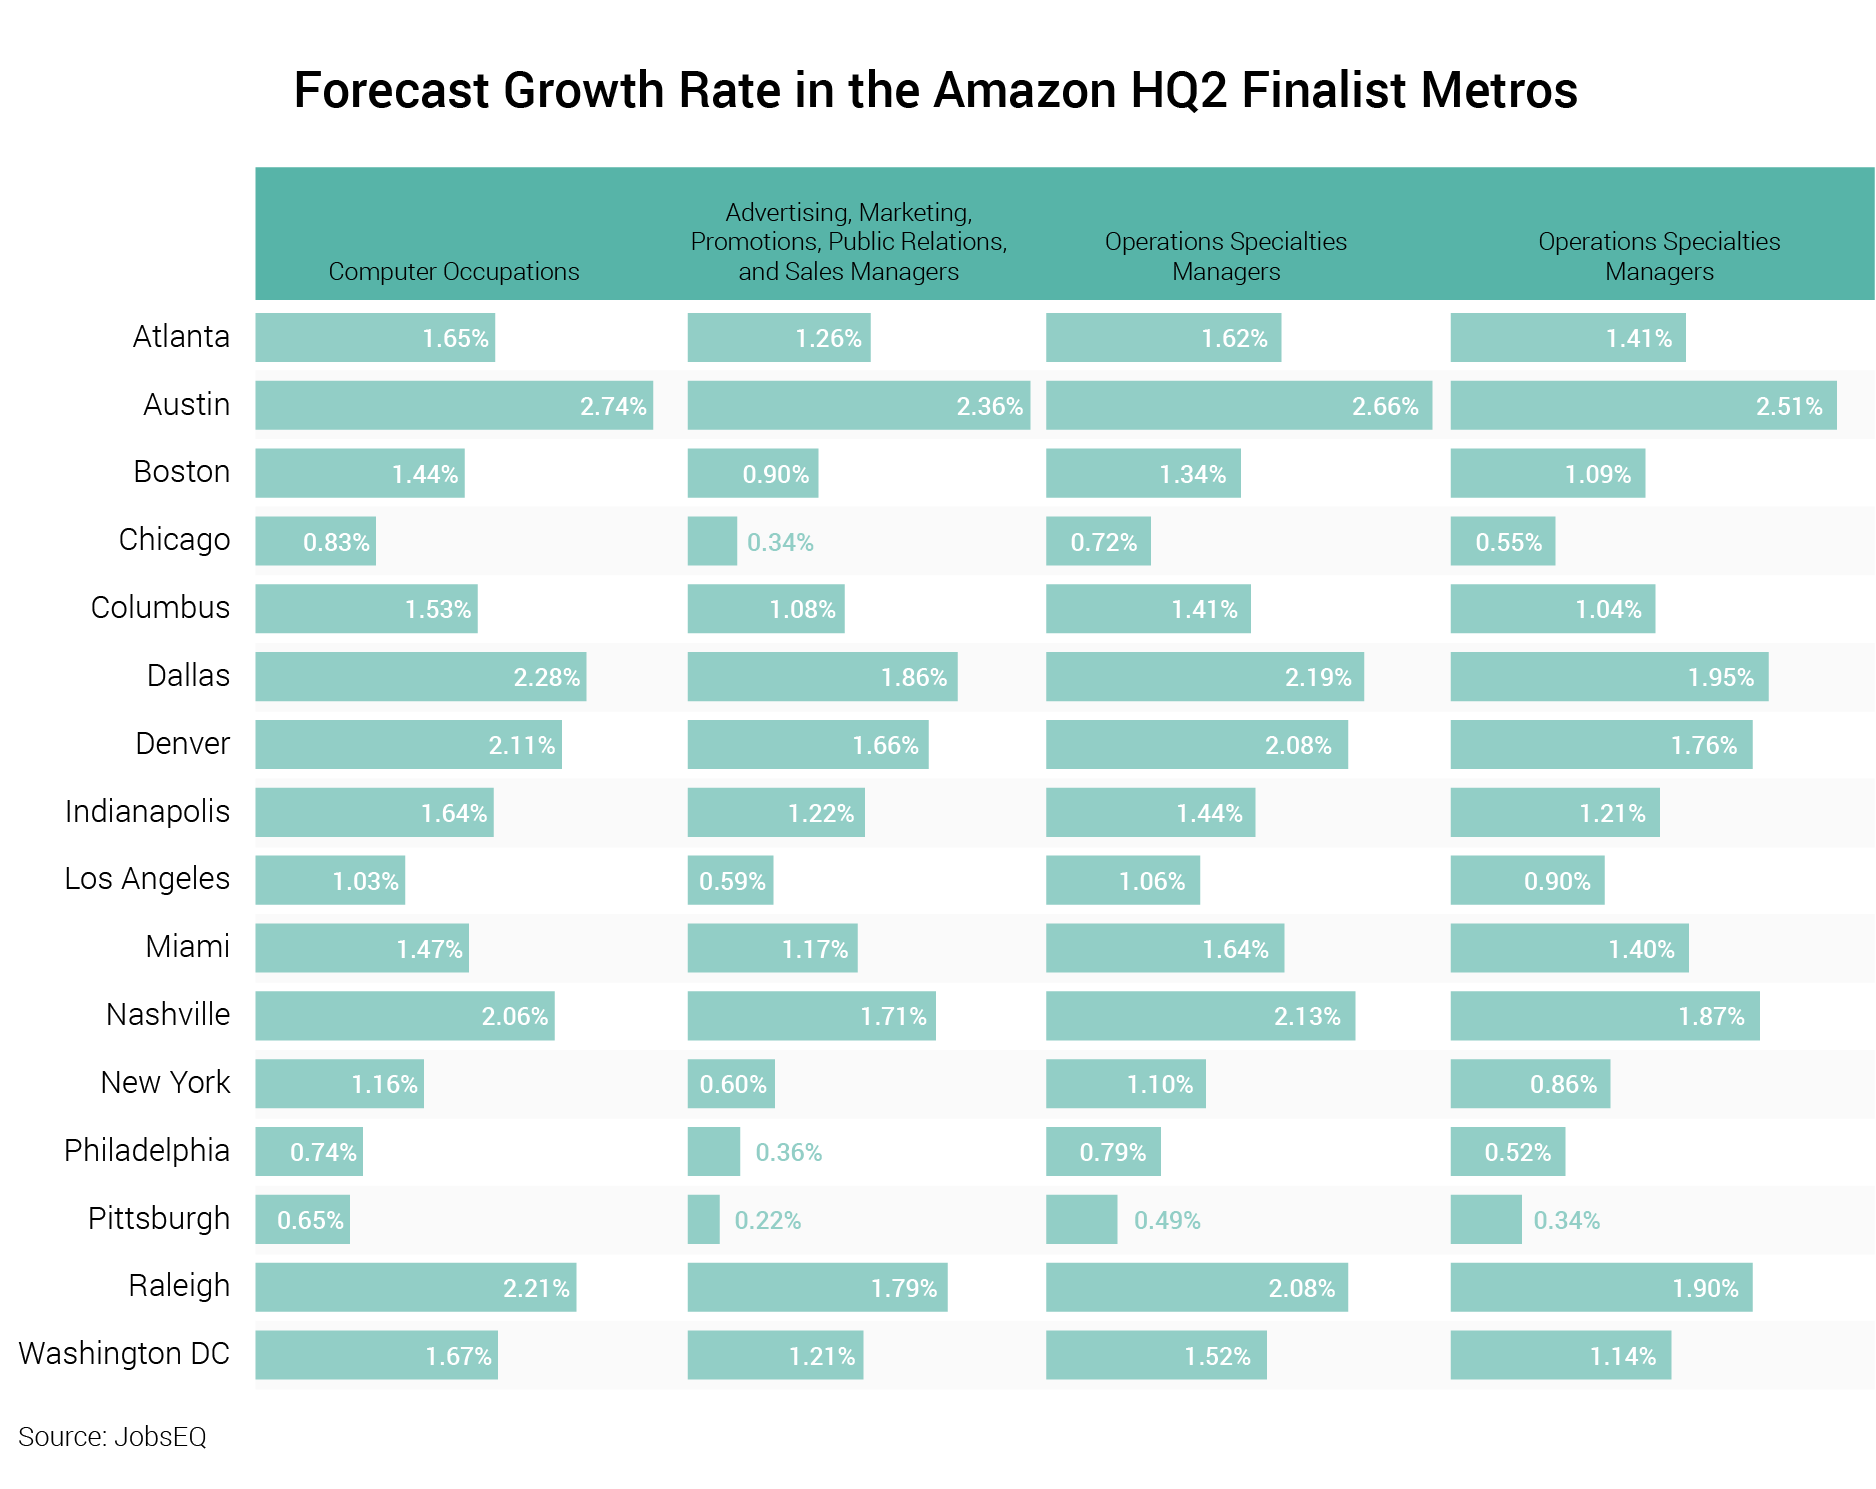
To first get a sense of the existing labor market in each region, we look at the current employment and forecast growth rate[2] for the four occupation groups, seen in the charts above. Notably, Austin is currently projected to be the fastest growing region in each of these four occupation groups, while Pittsburgh currently has the slowest expected growth rate. These figures are what we might expect, as they follow larger growth trends in these regions. In order to get a deeper look at the labor market for these occupation groups, we next turn to job postings data in the finalist regions.
JobsEQ RTI[3] data provides the following additional information about the job market in the finalist regions: the median duration, which measures the length of time a job posting typically stays open, and the JPLQ[4] (Job Posting Location Quotient) which is a measure of relative volume for job postings within a region.
The median duration can be useful in exploring labor supply by showing how difficult it is to fill a position within an occupation, with a longer median duration suggesting it is more difficult for firms to fill openings. There are a number of reasons why a firm may have difficulty filling a job opening, ranging from overall labor market conditions (example: as unemployment falls, there are less workers looking for a job, making it more difficult to fill open positions) to regional and occupation-specific reasons (example: if there is a relatively low volume of qualified applicants within a region, it is more difficult to fill openings). While the broader market conditions will be represented similarly across regions, the differences between regions provides insight on the region-specific conditions and a region’s labor supply.
Below is a graphic of the median duration for each occupation group and each metro area. Computer occupation openings appear to be relatively easier to fill than the other occupations, with every metro area having a median duration below 30 days, followed by business operation specialists, with the two management occupation groups taking relatively longer to fill. Of particular interest is the variation we see in the computer occupations group. At the low end, Columbus has a median duration of only 21 days and Atlanta has a median duration of 22 days, suggesting openings in these occupations tend to be filled relatively quickly in those regions. On the other end, Boston and Pittsburgh each show a median duration of 29 days. From a labor supply perspective, this suggests there may be a stronger relative supply of workers in these occupations in Columbus and Atlanta compared to Boston and Pittsburgh.
Moving to the other occupation groups, Nashville has the shortest duration for the advertising managers group at only 23 days, 9 days lower than New York at 32 days. For the business operations specialists group, there are four regions with a median duration of 23 days at the low end—Columbus, Denver, Indianapolis, and Washington DC—while there are two regions at the high end with a median duration of 30 days—Boston and New York. Lastly, in the operations managers group there is relatively little variation with only 4 days separating the lows in Austin and Washington DC at 27 days and the highs in Boston, Chicago, New York, Philadelphia, and Pittsburgh at 31 days. This smaller variation we see with the operations managers group suggests there is relatively little difference in the labor supply for these occupations across the different regions compared to the other occupation groups.
While the duration of job postings provides insight on the labor supply, we can use the JPLQ to explore labor demand in an occupation and region. The JPLQ is a measure of relative job posting volume, and for a given occupation is defined as the ratio of job postings to employment in a region divided by the same ratio in the nation. A JPLQ equal to one means that job postings per employment in a region matches the national baseline, while a JPLQ greater than one means that there is a larger volume of job postings in the region relative to the nation, implying that labor demand for that particular occupation is higher than average.

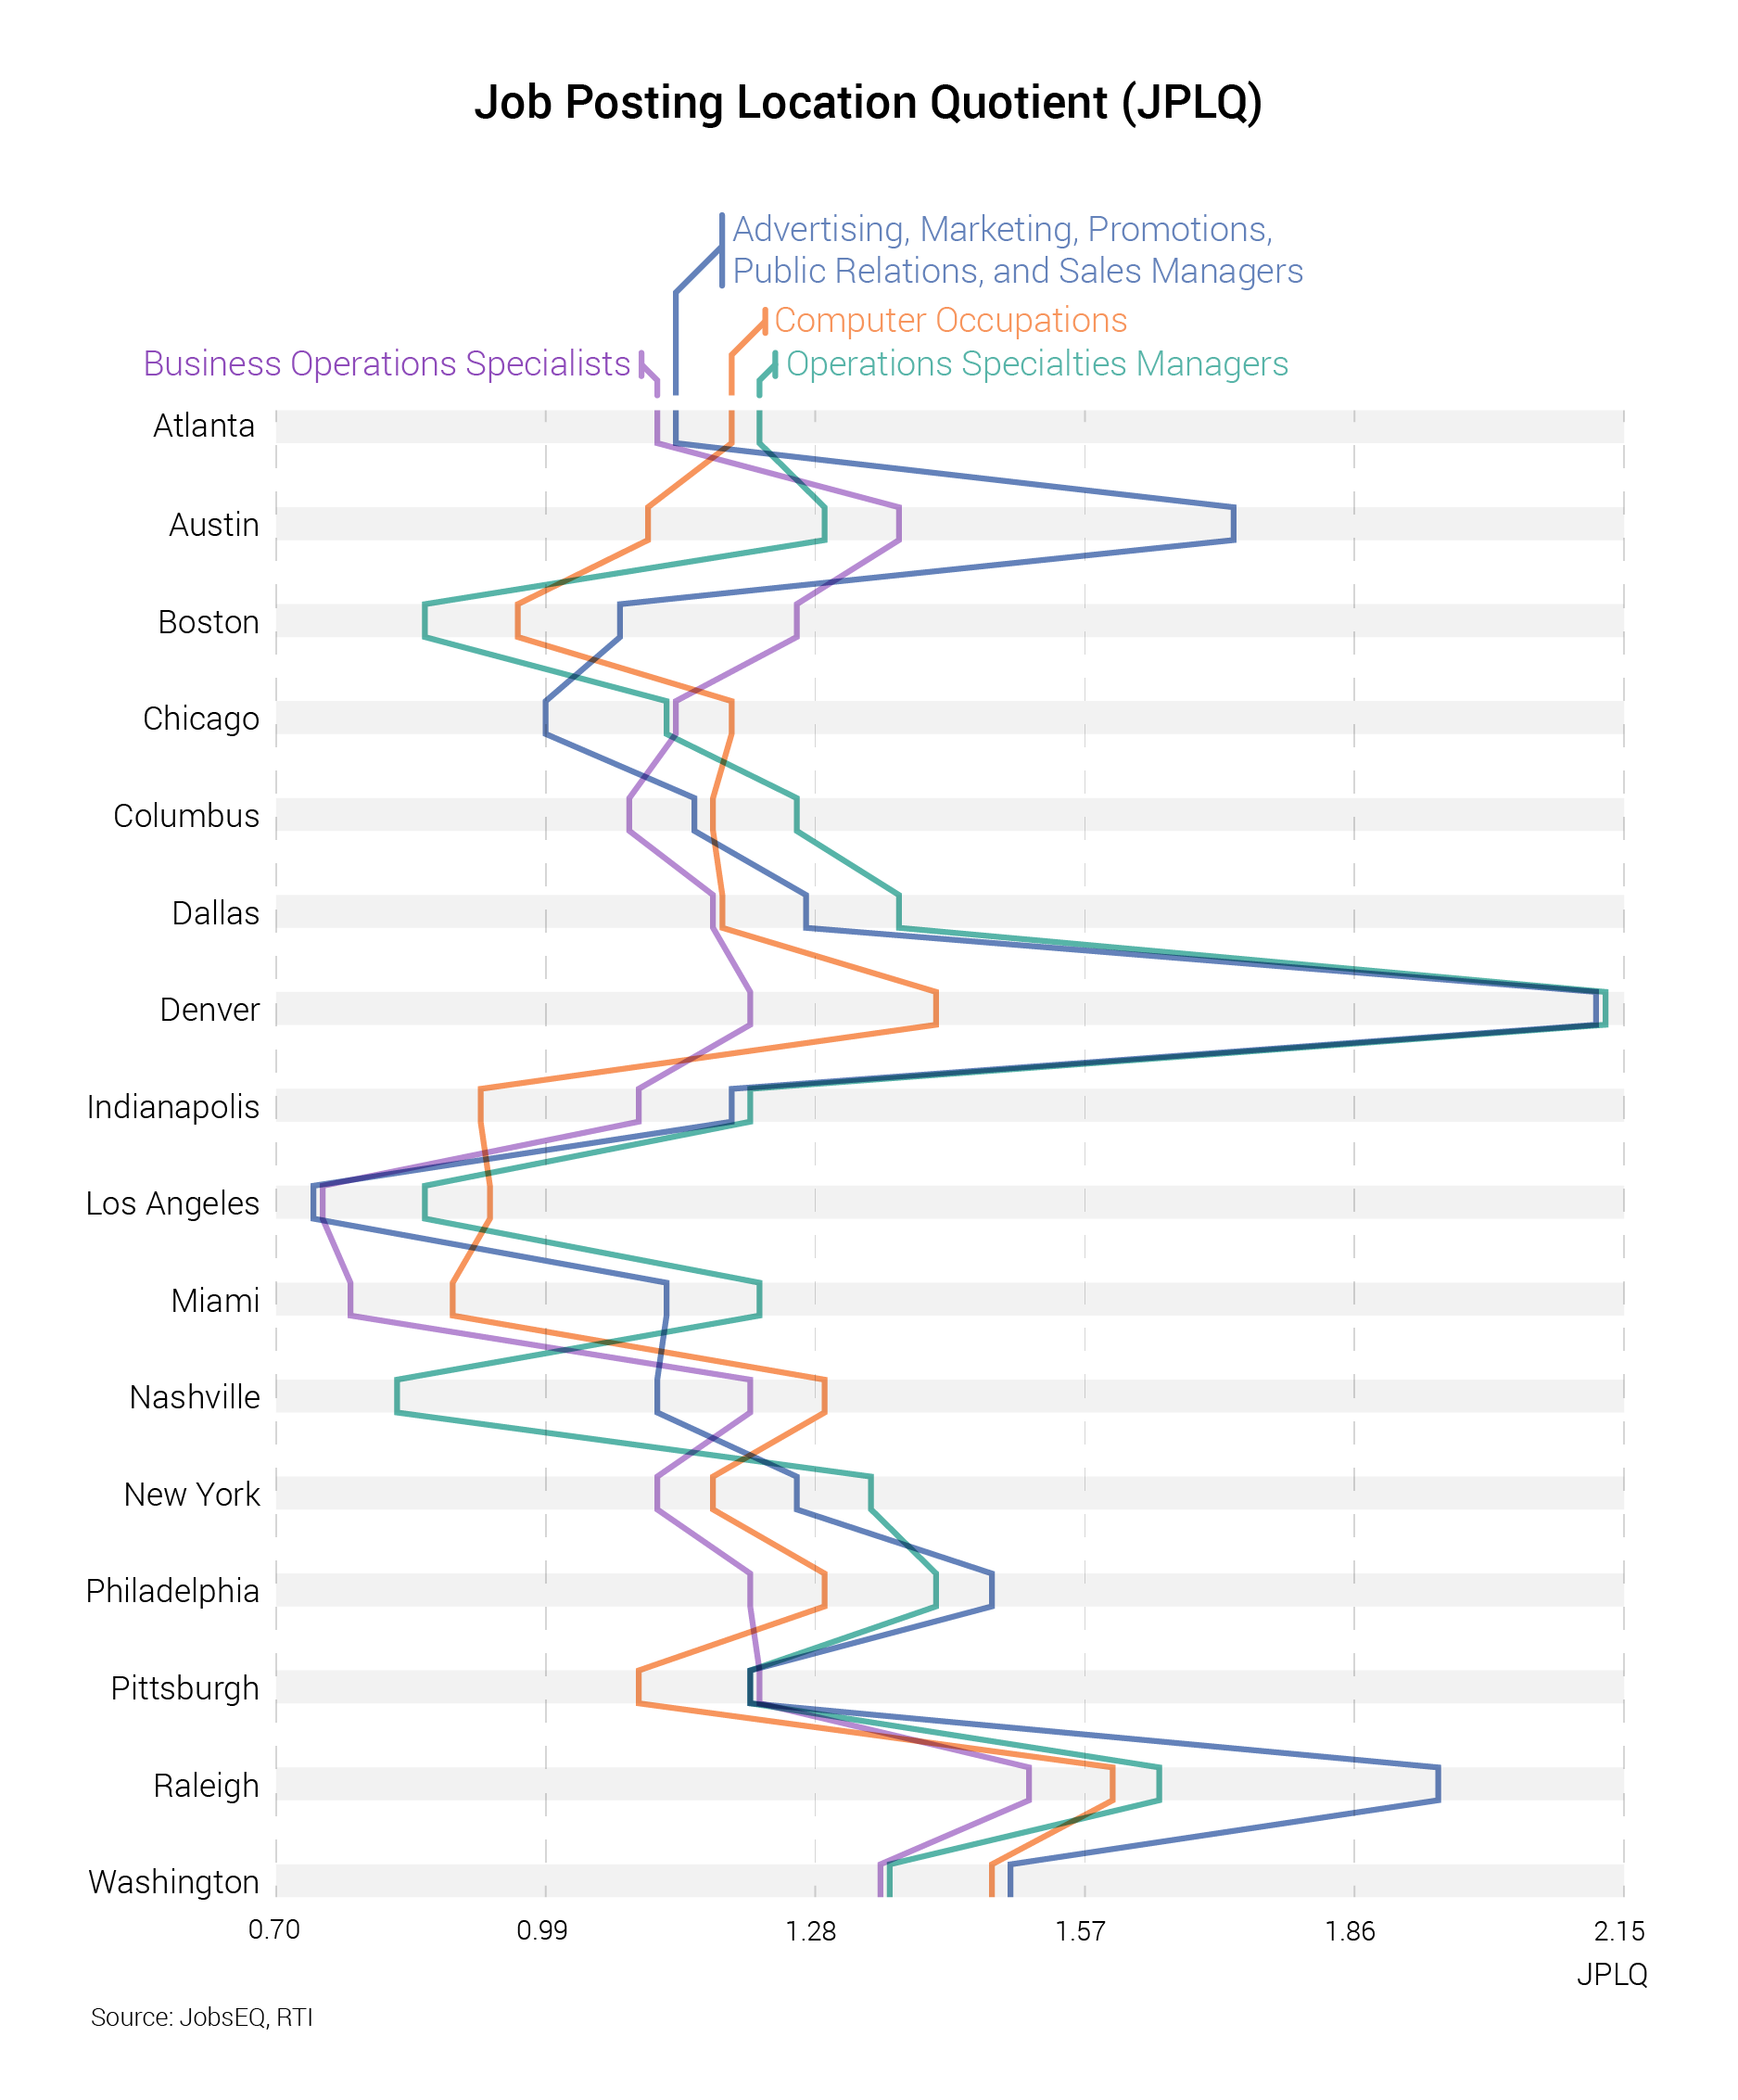
The above graphic shows the JPLQ for the four occupation groups in each metro area. First looking at computer occupations, in contrast to what we saw with the median durations, there is relatively little variation in the JPLQs, with only one region, Raleigh, having a JPLQ greater than 1.5 and the lowest being 0.88 in Miami. This tells us that labor demand in this occupation group is relatively consistent across these regions, which may speak to a larger consistent growth in demand for these occupations, as firms across the country are seeking to fill positions in these occupations. We see a similar pattern in the business operations specialists group, where excepting two lower end exceptions in Los Angeles and Miami—with JPLQs of 0.75 and 0.77, respectively—all other regions have a JPLQ above 1.0 and none greater than 1.5. Again, this suggest demand is relatively consistent in these occupations.
The two manager groups tell a more interesting story. In these we see much more variation with Denver leading in each group, with an JPLQ over 2.0 in each; while on the low end we see Los Angeles with a JPLQ of 0.74 and 0.86 in advertising managers and operations managers, respectively. Overall, comparing all four occupation groups, there appears to be a larger trend in a few of the regions. Denver and Raleigh have relatively high JPLQs in each group while Los Angeles, and to a lesser extent Miami, have relatively lower JPLQs. This suggests that demand is relatively high for these occupations in Denver and Raleigh as firms try to grow relative to the current employment levels. In Los Angeles and Miami, however, the growth and demand is much lower relative to current employment levels.
So, what can this analysis tell us about Amazon and it’s HQ2 location choice? From a recruitment perspective, Columbus or Atlanta look appealing because their low median durations for computer occupations suggests a strong labor supply for those occupations. At the same time, Denver and Raleigh may be less ideal as the high JPLQs in those regions suggest higher labor demand, meaning Amazon will be facing more competition for employees. Of course, Amazon is a unique case and this type of analysis cannot tell the whole story. For one thing, with Amazon being such a massive company, they will extend recruitment beyond the region in which they choose and may try to recruit the “best of the best” globally, not just locally. Additionally, Amazon will likely be able to pay more for workers than most of their competitors and that may result in them poaching top talent from existing employers, rather than recruiting workers specifically looking for work.
More broadly, though, this type of analysis using real-time job postings can provide insight for both firms and local governments in seeing what the current local labor market looks like and how it compares to other regions.
[1] This is every posting on Amazon’s job board from April 2017 through March 2018 and located in Seattle, WA.
[2] Employment and growth rates as of 2017Q4. Source: JobsEQ
[3] RTI job posting data used in this analysis are jobs that were posted in 2017Q4
[4] For a given occupation, the JPLQ = (# of job ads locally / employment locally) / (# of ads in USA / employment USA)