Demystifying GDP
Gross Domestic Product (GDP) is one of the most widely used and cited economic indicators. One cannot discuss the economy of a country or a region...
Chmura ’s economic impact model is an integral component of its proprietary JobsEQ technology platform. It gives practitioners in economic...
Chmura’s economic impact model is an integral component of its proprietary JobsEQ technology platform. It gives practitioners in economic development, workforce development, education, and other areas a tool to evaluate the economic impact of a potential project such as a business expansion or relocation. It allows for a seamless transition from JobsEQ’s industry and occupation data to economic impact analysis, thus ensuring data integrity and consistency.
Chmura’s economic impact model is based on economic theory related to the input-output (I-O) accounting of the U.S. economy, while incorporating other data sources and industry best practices. It starts with the national I-O matrix published by Bureau of Economic Analysis (BEA). With that, there remain three questions of practical importance and that is where various models differ.
There are several economic impact models. They all use the same fundamental economic I-O theory, and are based on the same national I-O matrix from BEA. However, each model uses its own proprietary method to address the three challenges noted above. Chmura’s methodology takes into consideration the regional industry mix, supply capacity, and economic diversity, among other factors, to estimate the I-O matrix for each county and state in the country. Using the latest wage and salary data, Chmura’s model converts the output multipliers into employment and labor income multipliers of a region. Finally, Chmura imputes the input-output matrix at the 6-digit NAICS industry level, utilizing the employment and wages of those industries.
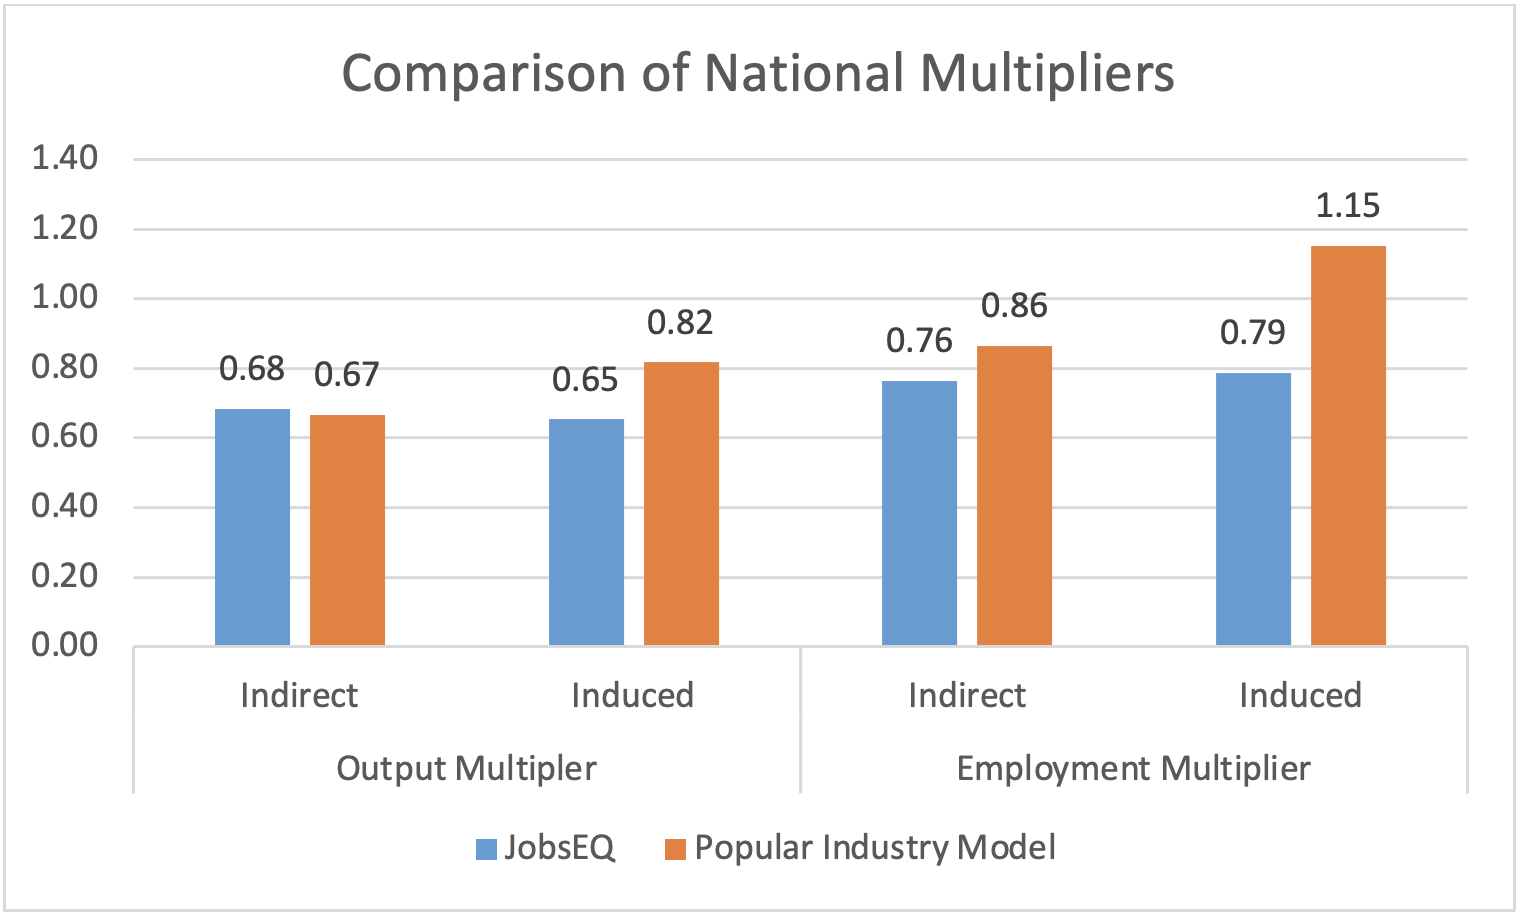
When comparing models from various providers, the indirect output multipliers[1] for the United States should be very similar in all models because these multipliers are almost the direct results of the inversion of the national I-O matrix which most models use (Figure 1). Other multipliers will vary based on customization by the provider.
At the national level, the first customization occurs for the induced output multipliers,[2] as different models use a variety of additional data to estimate the percentage of wages and salaries devoted to household spending.
The next customization occurs for employment multipliers. Differences in employment multipliers occur depending on the productivity and wage data used. Chmura takes a best-practice approach by using the latest productivity and wage data, which are updated quarterly. Other models may use annual wage data which are updated less frequently and thus result in larger employment multipliers. That is because, starting with the same amount of revenue, more jobs can be supported when wages are lower. Assuming wages increase over time, using the latest—thus typically higher—wages will yield lower estimates of jobs supported and smaller employment multipliers.
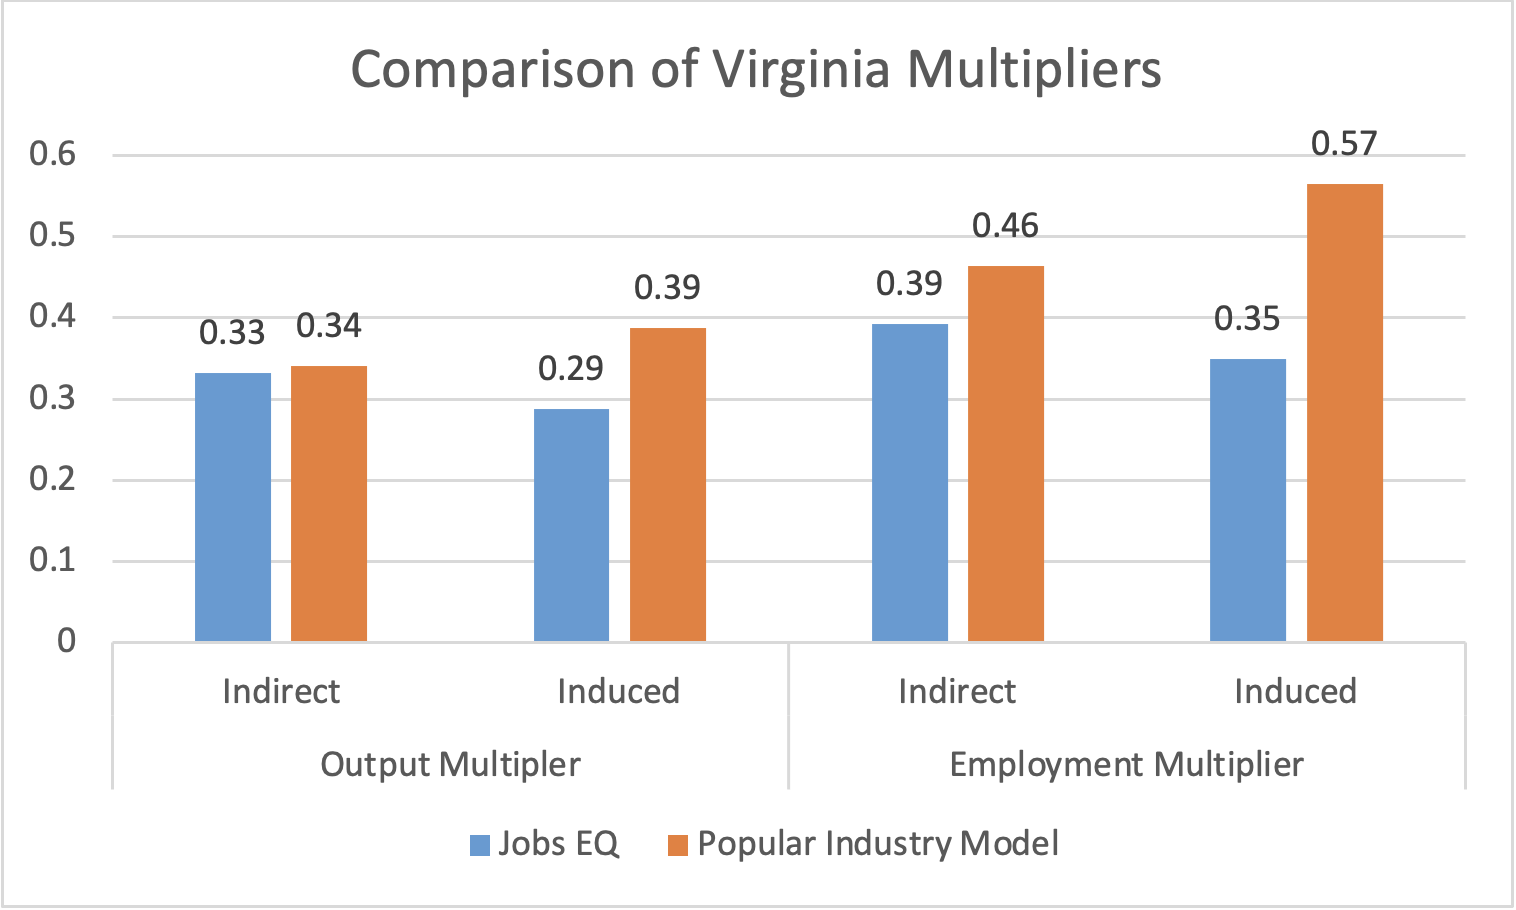
Different providers of economic impact models also have their own proprietary methodologies to estimate state and local impact multipliers. The essence of this process is to construct state and local input-output matrices based on the national matrix. Academic research indicates that many factors affect how much each industry purchases from local areas, including the availability and the size of supplying industries, industry mix, as well as trade flows. After regional input-output matrices are customized, indirect and induced output and employment multipliers can be calculated as was done for national multipliers.
Using Virginia as an example as shown in Figure 2, JobsEQ’s regional multipliers tend to be more conservative than some other popular impact software multipliers. The reasons lie in the customization method used by Chmura. As previously noted, Chmura uses the most recent quarterly wages in the model, which tends to result in lower employment multipliers.
Furthermore, Chmura uses additional methods to constrain economic multipliers. For example, in other impact models it is not uncommon to find county multipliers being larger than state multipliers for certain industries. Chmura’s model has geographic consistency checks so that multipliers are logically consistent when comparing a smaller region to a larger region in which it is contained (e.g. comparing a county to its state).
The multipliers in Chmura’s model are further refined with consistency checks via modeling of supply chain, regional gross domestic product (GDP), and productivity. It is verified in aggregate at the national level that the multipliers are consistent with national productivity data. Chmura computes county-level GDP data (based on employment and wages and BEA state- and industry-level GDP data) and the multipliers are checked for consistency with this data set. Furthermore, multipliers are used within regional supply chain modeling; feedback from this model is used to restrain the multipliers to ensure the model is logically consistent with local supply chain effects—for example, multipliers that are too high might imply manifest ripple effects that are inconsistent with the actual size and mix of industries within a local economy.
Finally, while economic multipliers from various models provide good estimates of the economic impact, they are still model estimates based on industry averages. The estimated multipliers may deviate from an actual event where specific suppliers are known. When supplier data are available, it is a good practice to incorporate business-specific data to generate more accurate multipliers. For that reason, Chmura’s economists routinely conduct business surveys and use that survey data to improve the estimation of economic multipliers.
[1] The indirect multipliers estimate ripple effects due to the supply chain, the economic activity generated by suppliers of goods and services to the industry in question.
[2] The induced multipliers are used to estimate ripple effects due to household spending, the economic activity generated by employees spending wages as consumers.
Gross Domestic Product (GDP) is one of the most widely used and cited economic indicators. One cannot discuss the economy of a country or a region...
The map here displays the Economic Diversity Index for all counties and metropolitan statistical areas (MSAs) in the United States. How economically...
The following blog is divided into two parts: Part I has been entirely generated by ChatGPT, Part II was written by Chmura economists and discusses...