.png)
Most people know that the percentage of older Americans is increasing dramatically. What’s less known to the average person is how that graying will impact different areas of the country.
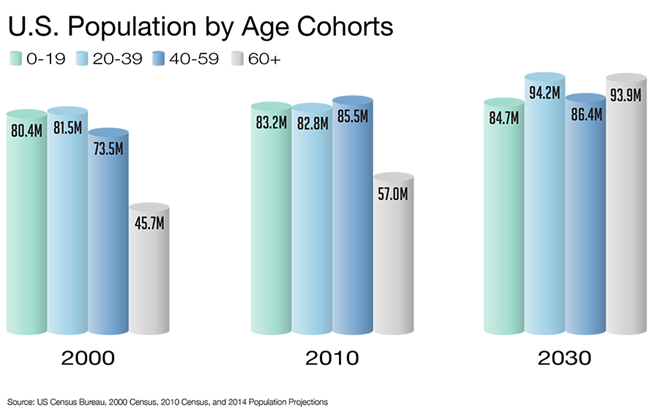
The overall demographic shift is illustrated in the chart below that shows four age cohorts. The first three are each based on equal twenty-year spreads: people age 0 to 19, those who are age 20 to 39, and the age group 40 to 59. The fourth cohort is defined as those age 60 and older.
The age group 60 and up was roughly 40% smaller than the other cohorts in 2000. By 2010 it had begun to close the gap, but it was still about a third smaller than the other cohorts. By 2030, however, this 60+ age group will be nearly the largest cohort—surging from 57 million in 2010 to over 93 million in 2030.
The reason for this increase is the aging of the baby boom generation along with the overall increase in life expectancy. The ramifications are many. The shift affects consumer spending patterns, health care needs, labor force mix, and so on.
The demographic shift will be manifest differently throughout the nation. The map below shows the age mix for every county in the nation as it transforms from 2010 through 2030. Each county is colored according to the cohort that is the largest during that given year (using the same cohorts from above).
A word about these data: the age mix data at the county level for 2010 are derived from the decennial census. The projections by age through 2030 at the national level follow forecasts from the Census Bureau. The county-level projections are produced by Chmura and can be accessed through the JobsEQ labor market system.
What do the data show? In 2010, fewer than 10% of the counties in the nation had demographic mixes where the 60+ age cohort was largest. By 2019, however, the 60+ cohort should be largest in over half of the counties. By 2027, this cohort is expected to be largest in three-quarters of the nation’s counties.
Largest Age Cohort by County, 2010-2030
-
Largest
Age Cohort -
0 to 19
-
20 to 39
-
40 to 59
-
60+
Areas of the country not expected to see the 60+ cohort become the largest during this timeframe include regions in Texas and California, various metropolitan areas, and counties with large college student populations—the latter of which stick out on the map among the light blue areas, as the age 20 to 39 cohort will remain the largest in these places.
The interaction of a shifting age mix and overall population growth also can create surprising effects. For example, the population of the Cincinnati metropolitan statistical area (MSA) is projected to grow an average annualized 0.5% from 2015 through 2030. This population growth, though, is being driven by expansion in the age 60+ cohort (+2.2% per year). The population age 0 to 59 in Cincinnati is expected to actually decline overall during this same period. And Cincinnati is not alone in this boat; other MSAs expected to see overall population growth but declines in population under age 60 are Philadelphia, Chicago, Memphis, Green Bay, Mobile, and many others.
The Social Security “full benefit retirement age” is currently 66 for people reaching that age today, and that will rise to 67 for people reaching that age in 2030. Despite this forestalling in retirement age, the number of people in the nation at full retirement age will increase substantially. From 12% at full retirement age in 2010, by 2030 in the United States approximately 18% will be at full retirement age.
This shift is shown among the largest metropolitan areas below. Despite variety in current mix and growth rates, a dramatic increase in the percentage of population at full retirement age is coming across the board.
| MSA | 2010 (% age 66+) | 2030 (% age 67+) |
|---|---|---|
| New York-Newark-Jersey City, NY-NJ-PA MSA | 12% | 18% |
| Los Angeles-Long Beach-Anaheim, CA MSA | 10% | 16% |
| Chicago-Naperville-Elgin, IL-IN-WI MSA | 11% | 17% |
| Dallas-Fort Worth-Arlington, TX MSA | 8% | 13% |
| Houston-The Woodlands-Sugar Land, TX MSA | 8% | 13% |
| Philadelphia-Camden-Wilmington, PA-NJ-DE-MD MSA | 12% | 19% |
| Washington-Arlington-Alexandria, DC-VA-MD-WV MSA | 9% | 14% |
| Miami-Fort Lauderdale-West Palm Beach, FL MSA | 15% | 20% |
| Atlanta-Sandy Springs-Roswell, GA MSA | 8% | 14% |
| Boston-Cambridge-Newton, MA-NH MSA | 12% | 18% |
| San Francisco-Oakland-Hayward, CA MSA | 12% | 17% |
| Phoenix-Mesa-Scottsdale, AZ MSA | 12% | 17% |
| Riverside-San Bernardino-Ontario, CA MSA | 10% | 15% |
| Detroit-Warren-Dearborn, MI MSA | 12% | 19% |
| Seattle-Tacoma-Bellevue, WA MSA | 10% | 16% |
| Minneapolis-St. Paul-Bloomington, MN-WI MSA | 10% | 16% |
| San Diego-Carlsbad, CA MSA | 11% | 16% |
| Tampa-St. Petersburg-Clearwater, FL MSA | 16% | 22% |
| St. Louis, MO-IL MSA | 13% | 19% |
| Baltimore-Columbia-Towson, MD MSA | 12% | 18% |
| Denver-Aurora-Lakewood, CO MSA | 9% | 15% |
| Charlotte-Concord-Gastonia, NC-SC MSA | 10% | 16% |
| Pittsburgh, PA MSA | 16% | 24% |
| Portland-Vancouver-Hillsboro, OR-WA MSA | 11% | 17% |
| San Antonio-New Braunfels, TX MSA | 10% | 15% |
| Orlando-Kissimmee-Sanford, FL MSA | 12% | 17% |
| Sacramento--Roseville--Arden-Arcade, CA MSA | 11% | 17% |
| Cincinnati, OH-KY-IN MSA | 11% | 18% |
| Kansas City, MO-KS MSA | 11% | 17% |
| Las Vegas-Henderson-Paradise, NV MSA | 11% | 15% |
| Cleveland-Elyria, OH MSA | 14% | 22% |
| Columbus, OH MSA | 10% | 16% |
| Indianapolis-Carmel-Anderson, IN MSA | 10% | 16% |
| San Jose-Sunnyvale-Santa Clara, CA MSA | 10% | 15% |
| Austin-Round Rock, TX MSA | 8% | 13% |
| Nashville-Davidson--Murfreesboro--Franklin, TN MSA | 10% | 16% |
| Virginia Beach-Norfolk-Newport News, VA-NC MSA | 11% | 17% |
| Providence-Warwick, RI-MA MSA | 13% | 21% |
| Milwaukee-Waukesha-West Allis, WI MSA | 12% | 18% |
| Jacksonville, FL MSA | 11% | 18% |
| Memphis, TN-MS-AR MSA | 10% | 16% |
| Oklahoma City, OK MSA | 11% | 16% |
| Louisville/Jefferson County, KY-IN MSA | 12% | 19% |
| Richmond, VA MSA | 11% | 18% |
| New Orleans-Metairie, LA MSA | 11% | 18% |
| Raleigh, NC MSA | 8% | 14% |
| Hartford-West Hartford-East Hartford, CT MSA | 13% | 20% |
| Salt Lake City, UT MSA | 8% | 13% |
| Birmingham-Hoover, AL MSA | 12% | 19% |
| Buffalo-Cheektowaga-Niagara Falls, NY MSA | 15% | 22% |
| Source: Chmura Economics & Analytics, JobsEQ | ||
Research support was provided by Allison Magee and Asim Timalsina