.png)
Each of Ohio’s nine target industries added employment1 in 2012 and five of the nine sectors posted job growth far stronger than Ohio’s overall job growth of 1.8% during the year. Target industry job gains were led by Ohio’s BioHealth sector, which mostly comprises pharmaceutical and medical equipment manufacturing, posting 14.1% year-over-year growth in the fourth quarter of 2012. The Energy sector also saw strong gains, due in large part to the development of Ohio’s shale gas reserves. What is especially impressive about the job gains in the BioHealth and Energy sectors is that these are two target industries where Ohio is only beginning to develop a competitive cluster—as gauged by the state’s location quotient.
| Sector |
Employment |
Employment Change Q4-2011 - |
Average |
Location Quotient |
| Ohio - BioHealth |
17,306 |
14.1% |
$56,381 |
0.65 |
| Ohio - Energy |
44,403 |
7.8% |
$76,895 |
0.64 |
| Ohio - Food Processing |
62,455 |
5.2% |
$47,921 |
0.99 |
| Ohio - Information Technology and services |
84,306 |
4.5% |
$71,307 |
0.95 |
| Ohio - Automotive |
90,616 |
4.3% |
$62,138 |
2.72 |
| Ohio - Financial Services |
174,692 |
1.6% |
$66,487 |
0.98 |
| Ohio - Advanced Manufacturing |
121,232 |
0.8% |
$62,938 |
2.43 |
| Ohio - Polymers and Chemicals |
90,437 |
0.7% |
$58,874 |
2.04 |
| Ohio - Aviation & Aerospace |
38,802 |
0.3% |
$79,650 |
0.72 |
| Ohio - Total All Target Industries |
724,249 |
2.8% |
$64,460 |
1.53 |
| Ohio - Total All Industries |
5,036,462 |
1.8% |
$44,059 |
1.00 |
The location quotient is measure of how big these industries are given the overall size of Ohio’s economy. In this case, a location quotient less than one indicates an industry that is underweight in terms of what one might expect given the overall size of Ohio’s economy. In this context, given Ohio’s assets and labor market strengths, there can be optimism that these two industries will continue to expand employment over the next three to five years and Ohio will see the location quotient in these two sectors move from below to above one. If the location quotient of these two sectors approached the average for location quotient all of Ohio’s target industries (1.53), this would translate into the creation of more than 80,000 new jobs.
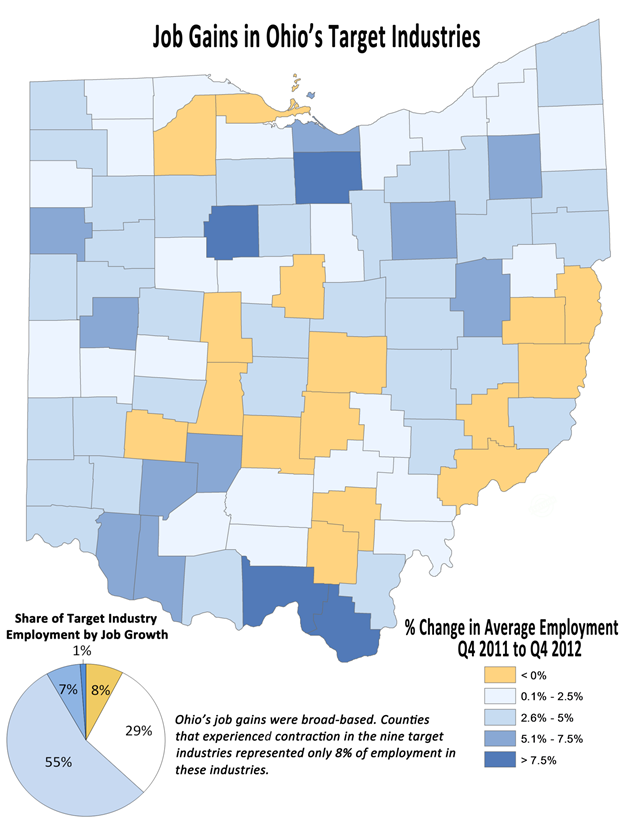
In addition to the strong growth in Ohio’s target industries in 2012 was the fact that these job gains were spread out across the state. Seventy two of Ohio’s 88 counties experienced at least some job growth in these nine target industries. In fact, some of the strongest year-over-year job gains were in rural communities which saw Ohio’s target industries collectively growing in excess of 5%. Only about 11% of Ohio’s counties saw job declines in aggregate employment in these target industries. Similarly, in the BioHealth, Energy, Financial Services, Food Processing, and Information Technology sectors, more than 75% of all Ohio counties with these industries experienced job growth in 2012. The BioHealth sector expanded last year in 95% of the counties where it was present. In the more traditional manufacturing groups—Advance Manufacturing, Automotive, Aviation and Aerospace, and Chemicals and Polymers—the employment gains were slightly more concentrated with only about two-thirds of Ohio’s counties registering employment gains in these sectors. Employment changes were the most mixed in the advanced manufacturing sector which registered job gains in 52 counties, but job losses in 34 counties.
| Top 10 Counties in Job Gains for Ohio’s Target Industries |
Average |
Average |
Year-over- |
| Wyandot County, Ohio |
2,441 |
2,687 |
10% |
| Lawrence County, Ohio |
602 |
657 |
9% |
| Scioto County, Ohio |
1,560 |
1,692 |
8% |
| Huron County, Ohio |
3,363 |
3,624 |
8% |
| Erie County, Ohio |
5,749 |
6,154 |
7% |
| Brown County, Ohio |
1,011 |
1,082 |
7% |
| Van Wert County, Ohio |
2,493 |
2,649 |
6% |
| Fayette County, Ohio |
1,727 |
1,832 |
6% |
| Wayne County, Ohio |
8,892 |
9,395 |
6% |
| Tuscarawas County, Ohio |
4,264 |
4,497 |
5% |
| Source: JobsEQ |
|||
| Ohio Target Industries |
Counties with Expanding |
Counties with |
Number of |
| Ohio - Advanced Manufacturing |
60% |
40% |
86 |
| Ohio - Automotive |
68% |
33% |
80 |
| Ohio - Aviation & Aerospace |
68% |
32% |
57 |
| Ohio - BioHealth |
96% |
4% |
54 |
| Ohio - Energy |
85% |
15% |
88 |
| Ohio - Financial Services |
75% |
25% |
88 |
| Ohio - Food Processing |
83% |
17% |
84 |
| Ohio - Information Technology and services |
97% |
3% |
88 |
| Ohio - Polymers and Chemicals |
67% |
33% |
81 |
| Source: JobsEQ |
|||
- Employment figures in this article reflect average Quarterly Census of Employment and Wages (QCEW) employment in Q4 2011 compared to Chmura’s preliminary estimate for average employment in Q4 2012, which is subject to revision. QCEW employment data at the county level was not available beyond Q2 2012 at the time of this publication.